To access this page, you need the Integration Log View permission.
To open webhook logs, click on Integration settings → Integration logs:
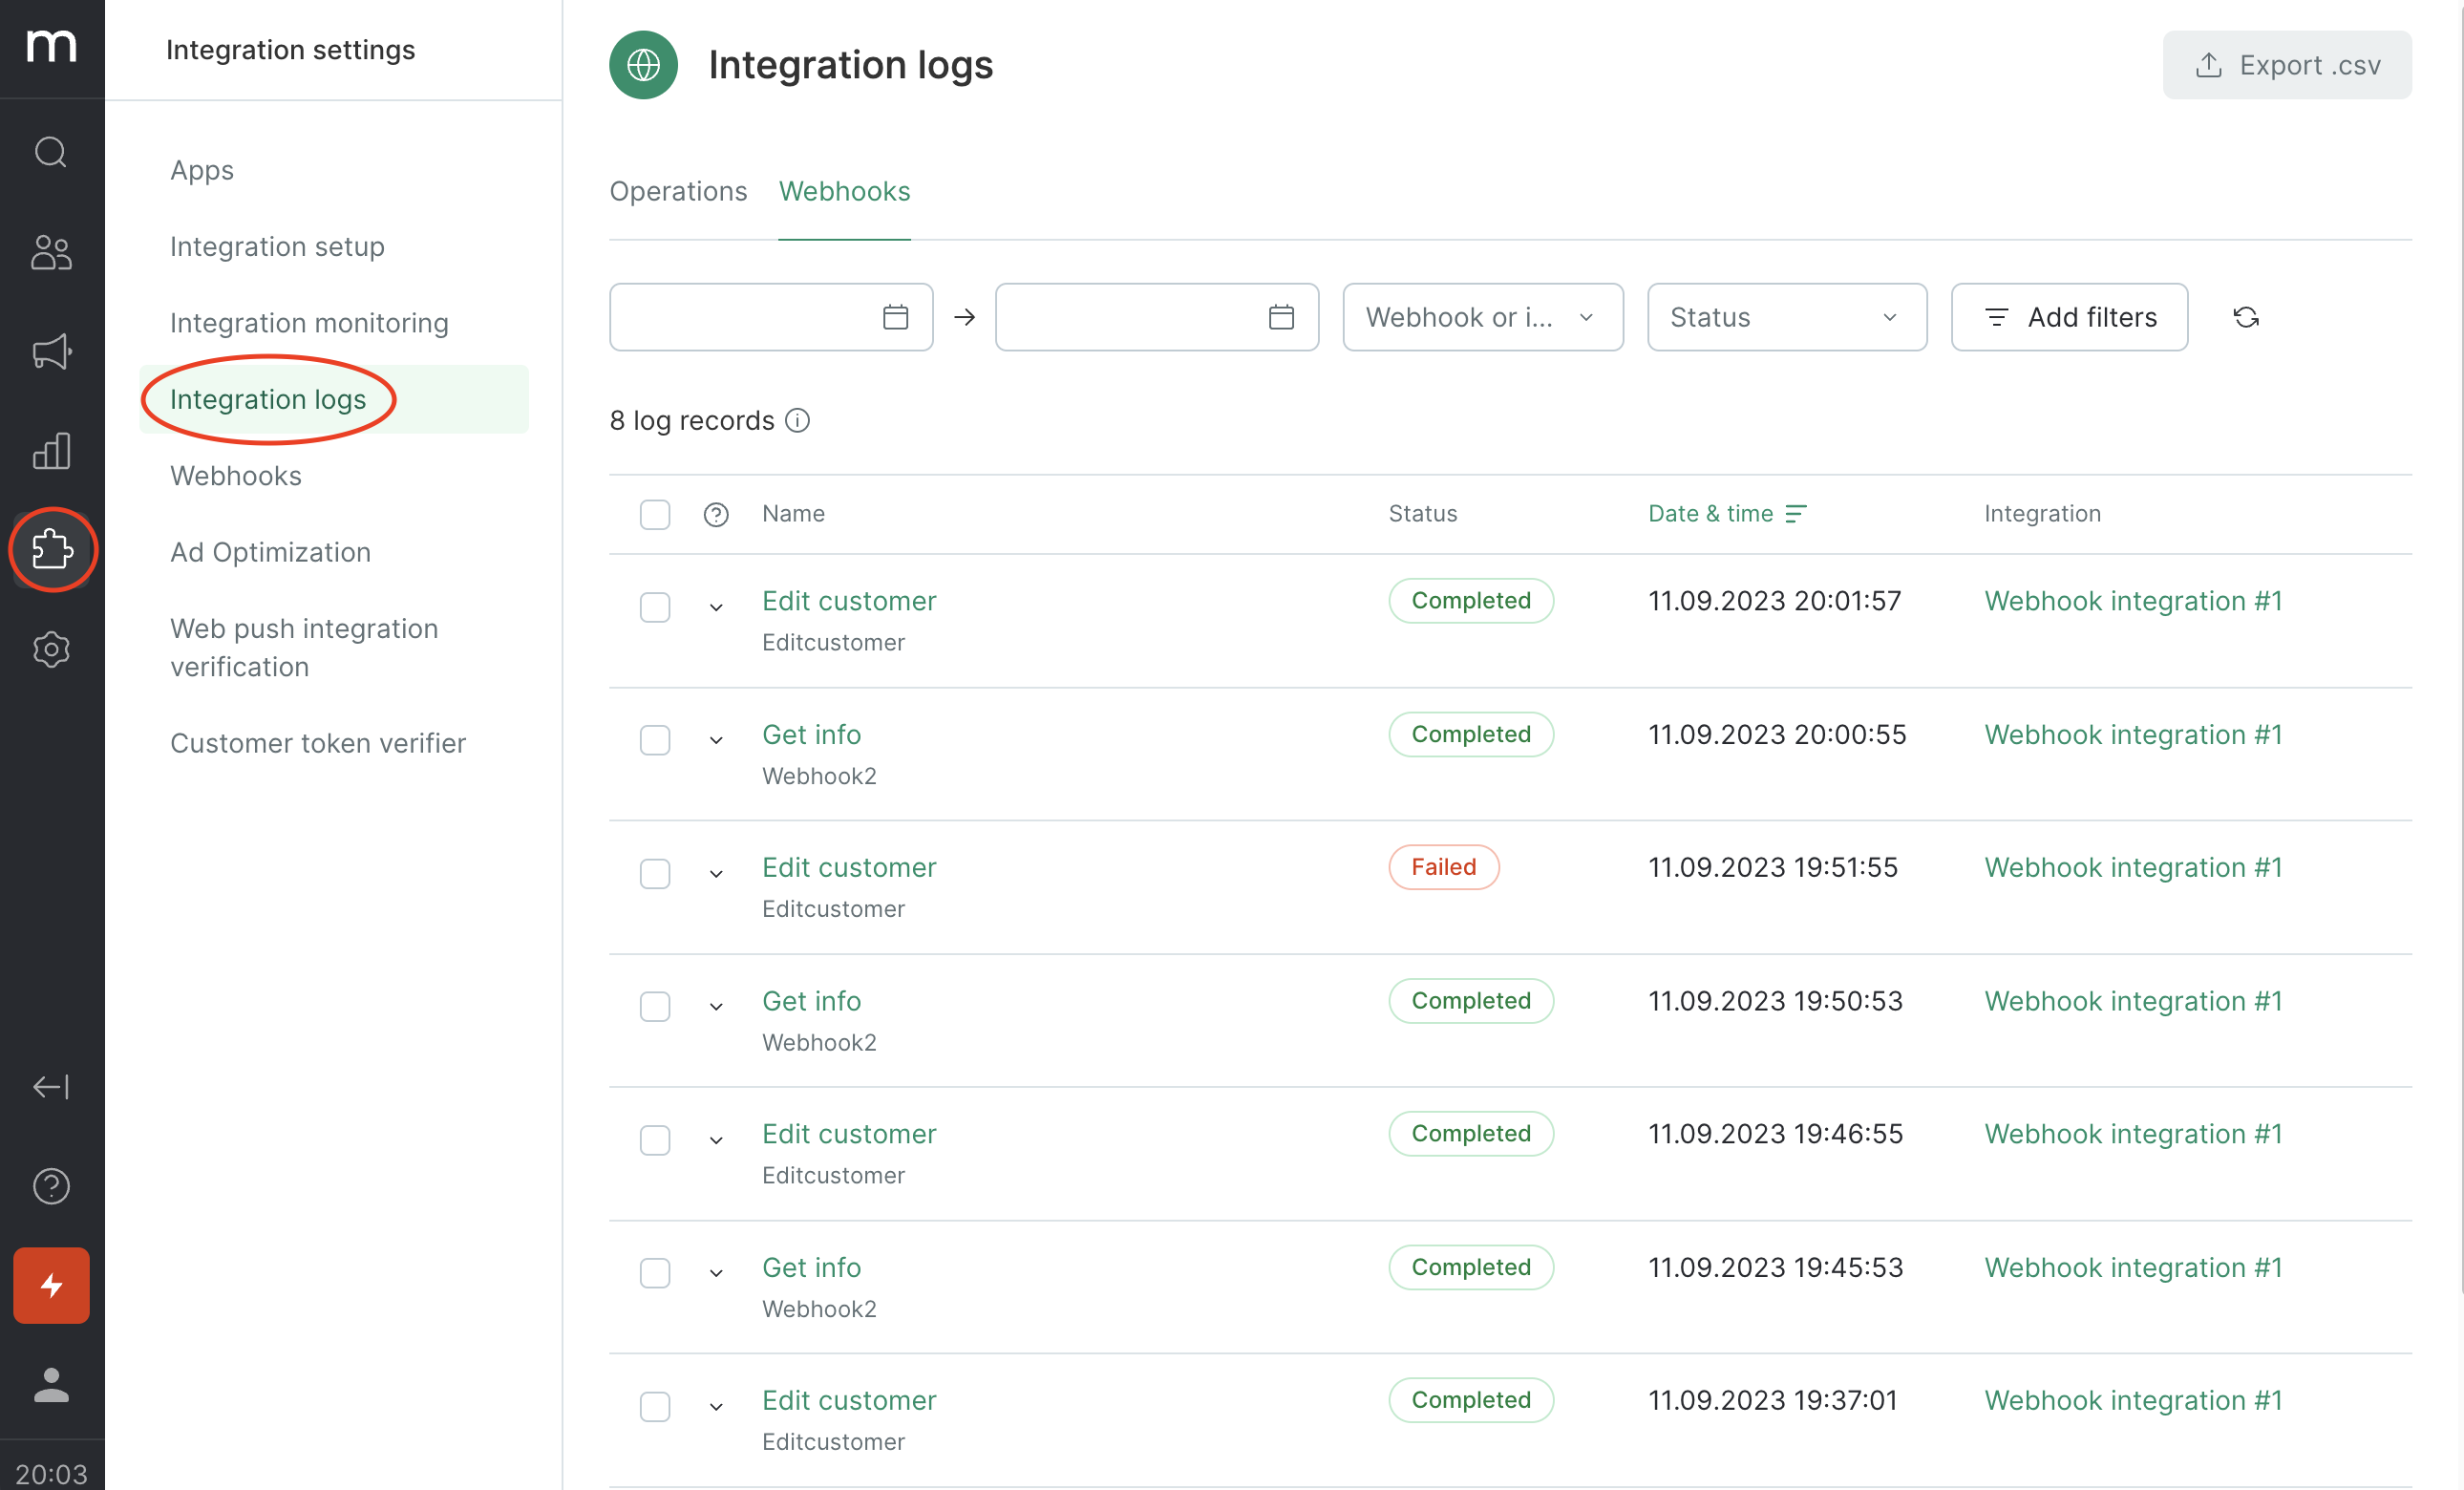
The list includes all the requests made in the last 14 days.
They can be filtered by dates, integration points and webhook names, request statuses, log IDs, URLs, and request bodies.
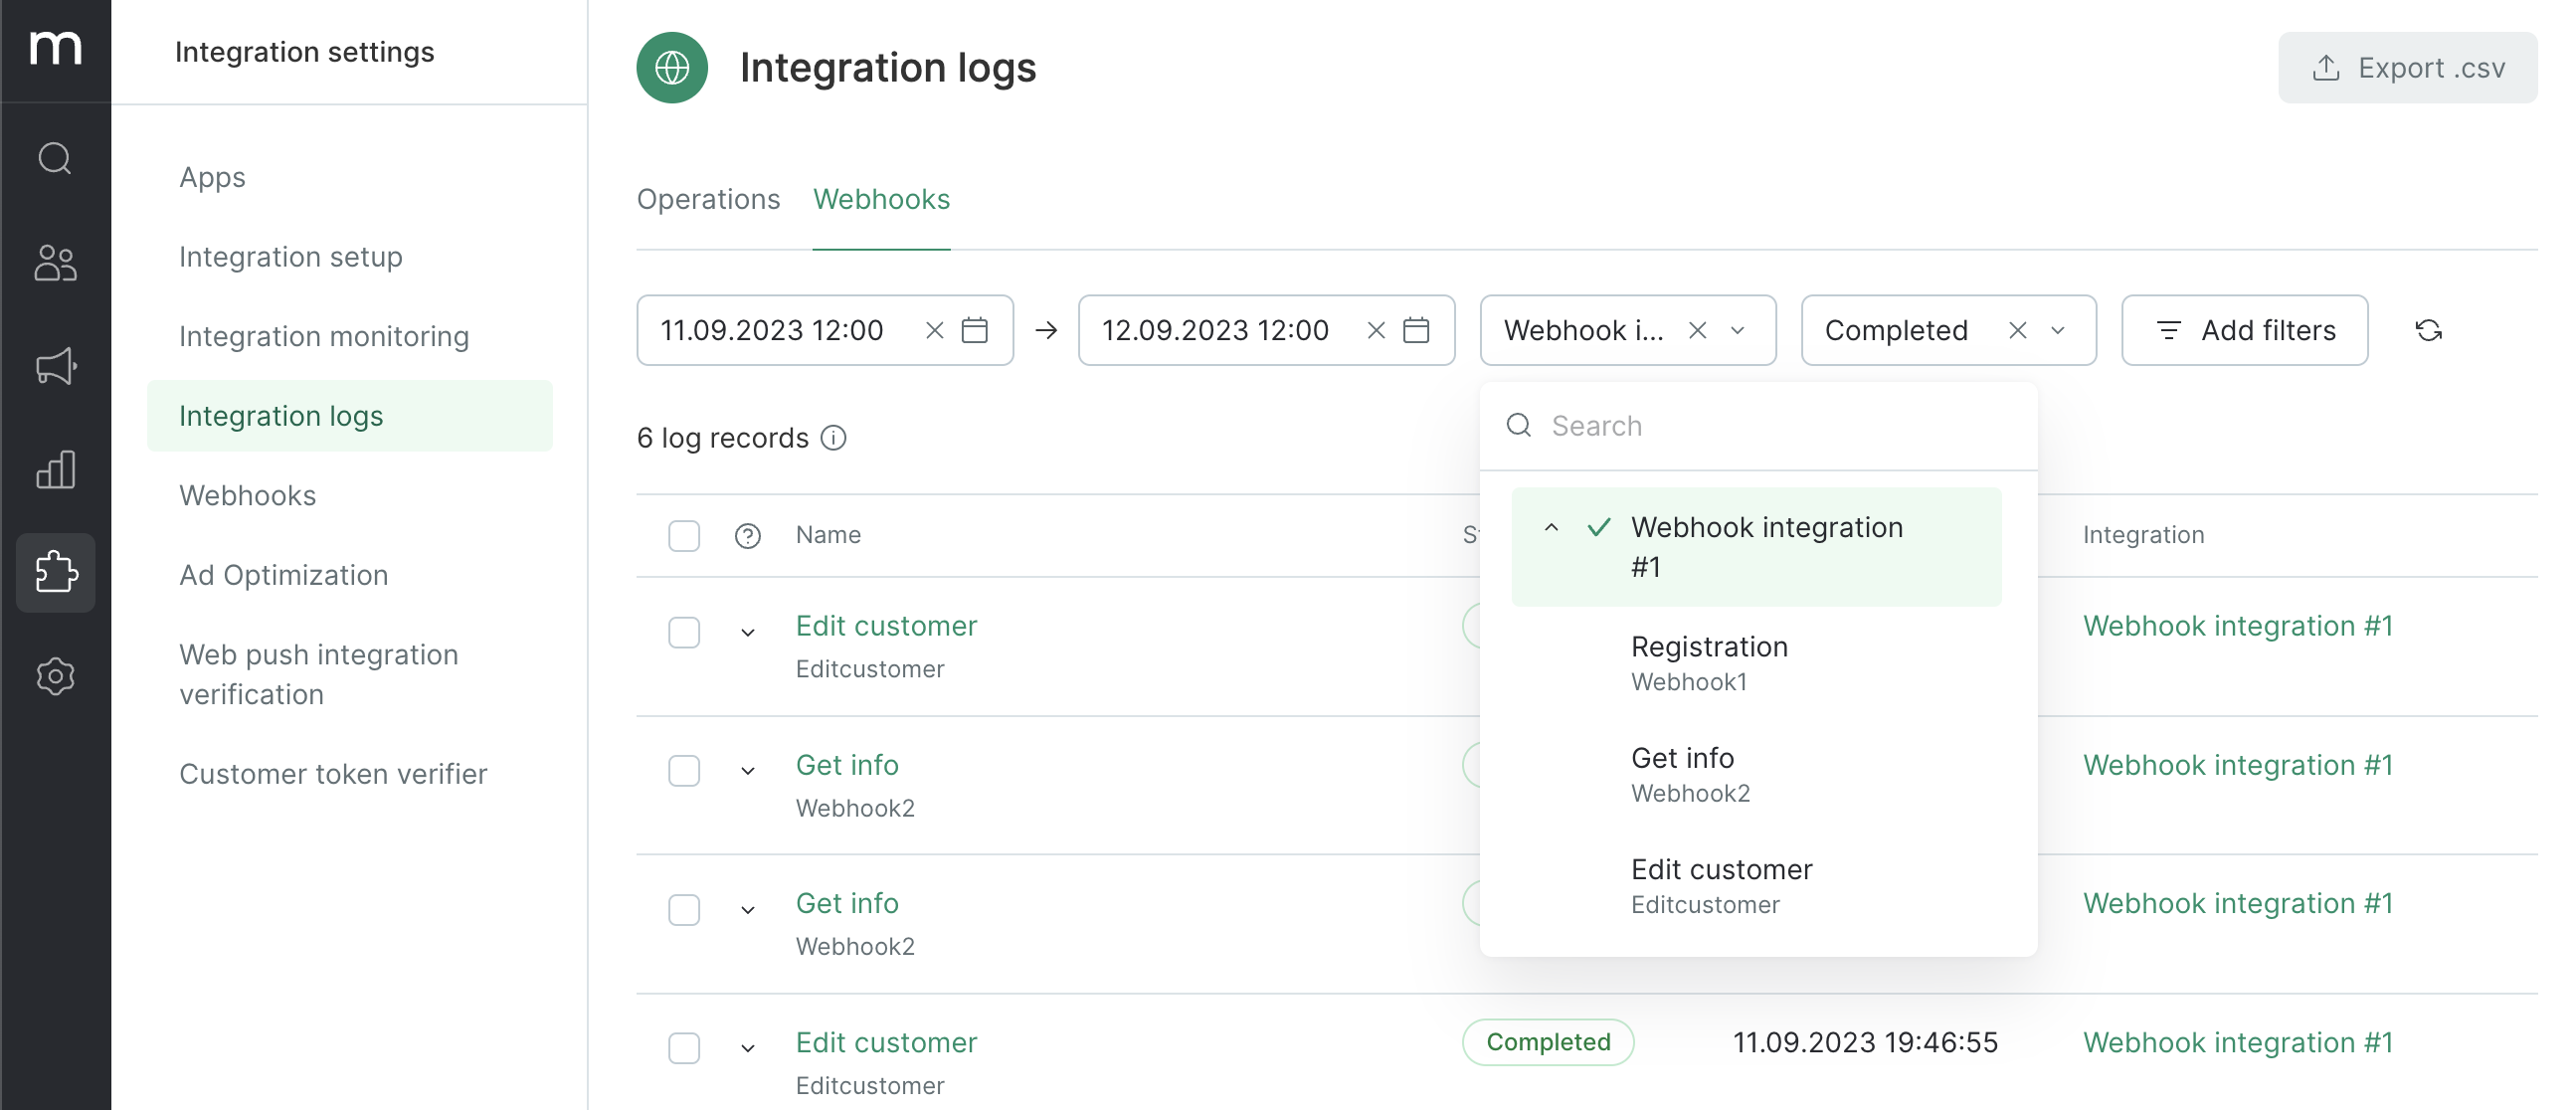
The page always displays the number of logs found, but you can browse only the most recent 500 records. To view more records, you need to export them.
Filter the log selection to ensure accuracy, then upload all the found requests.
You can upload the resulting CSV file to a table editor and use the in-built features to filter and group lines.
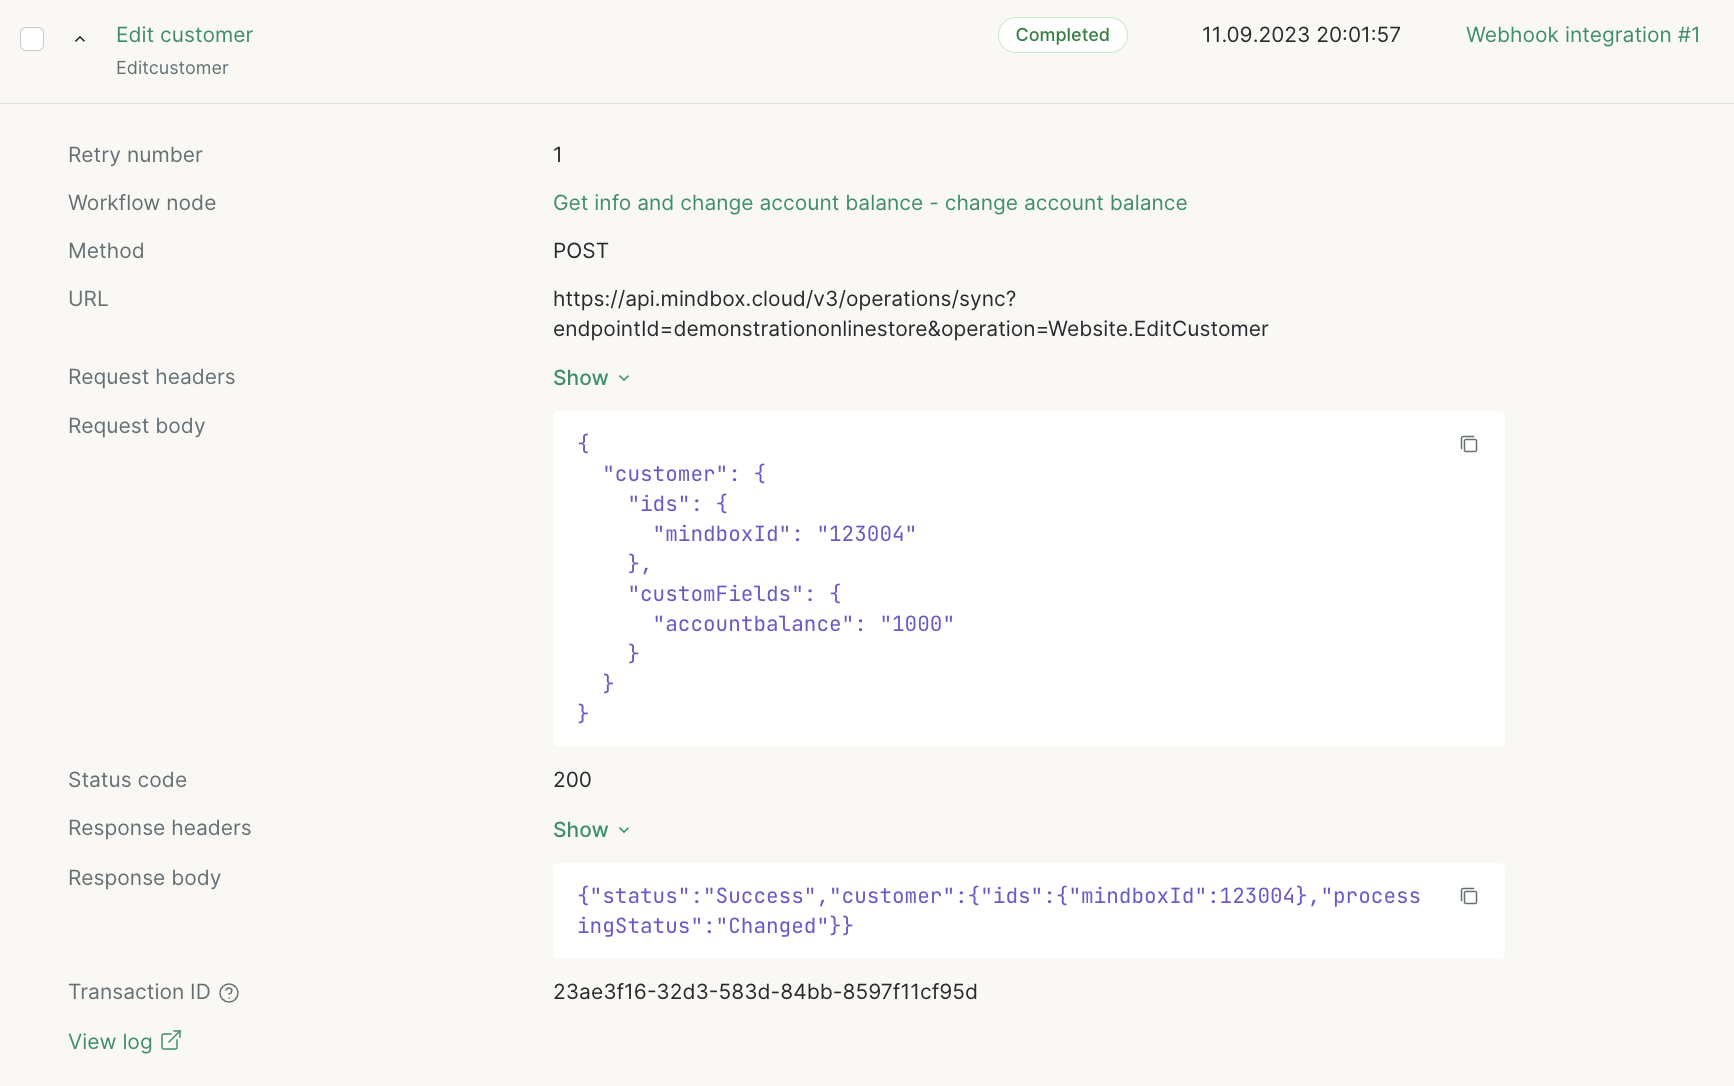
Open a line to view information about a particular request:
- a method and URL request;
- headings and a request body;
- headings and a response body;
- log ID;
- the flow node where the webhook was requested;
- the link to this request (including any repeat requests).
The response time is 30 seconds. If the service fails to respond on time or there is a network error, the response will not be saved in the log.
The logs are added to the list once the final request result shows that the request has been completed. While waiting, the system does not record the log.
How logs are exported
To export logs from the platform, users need the Integration Logs Export permission.
To export logs, select the required requests and click the Export button:
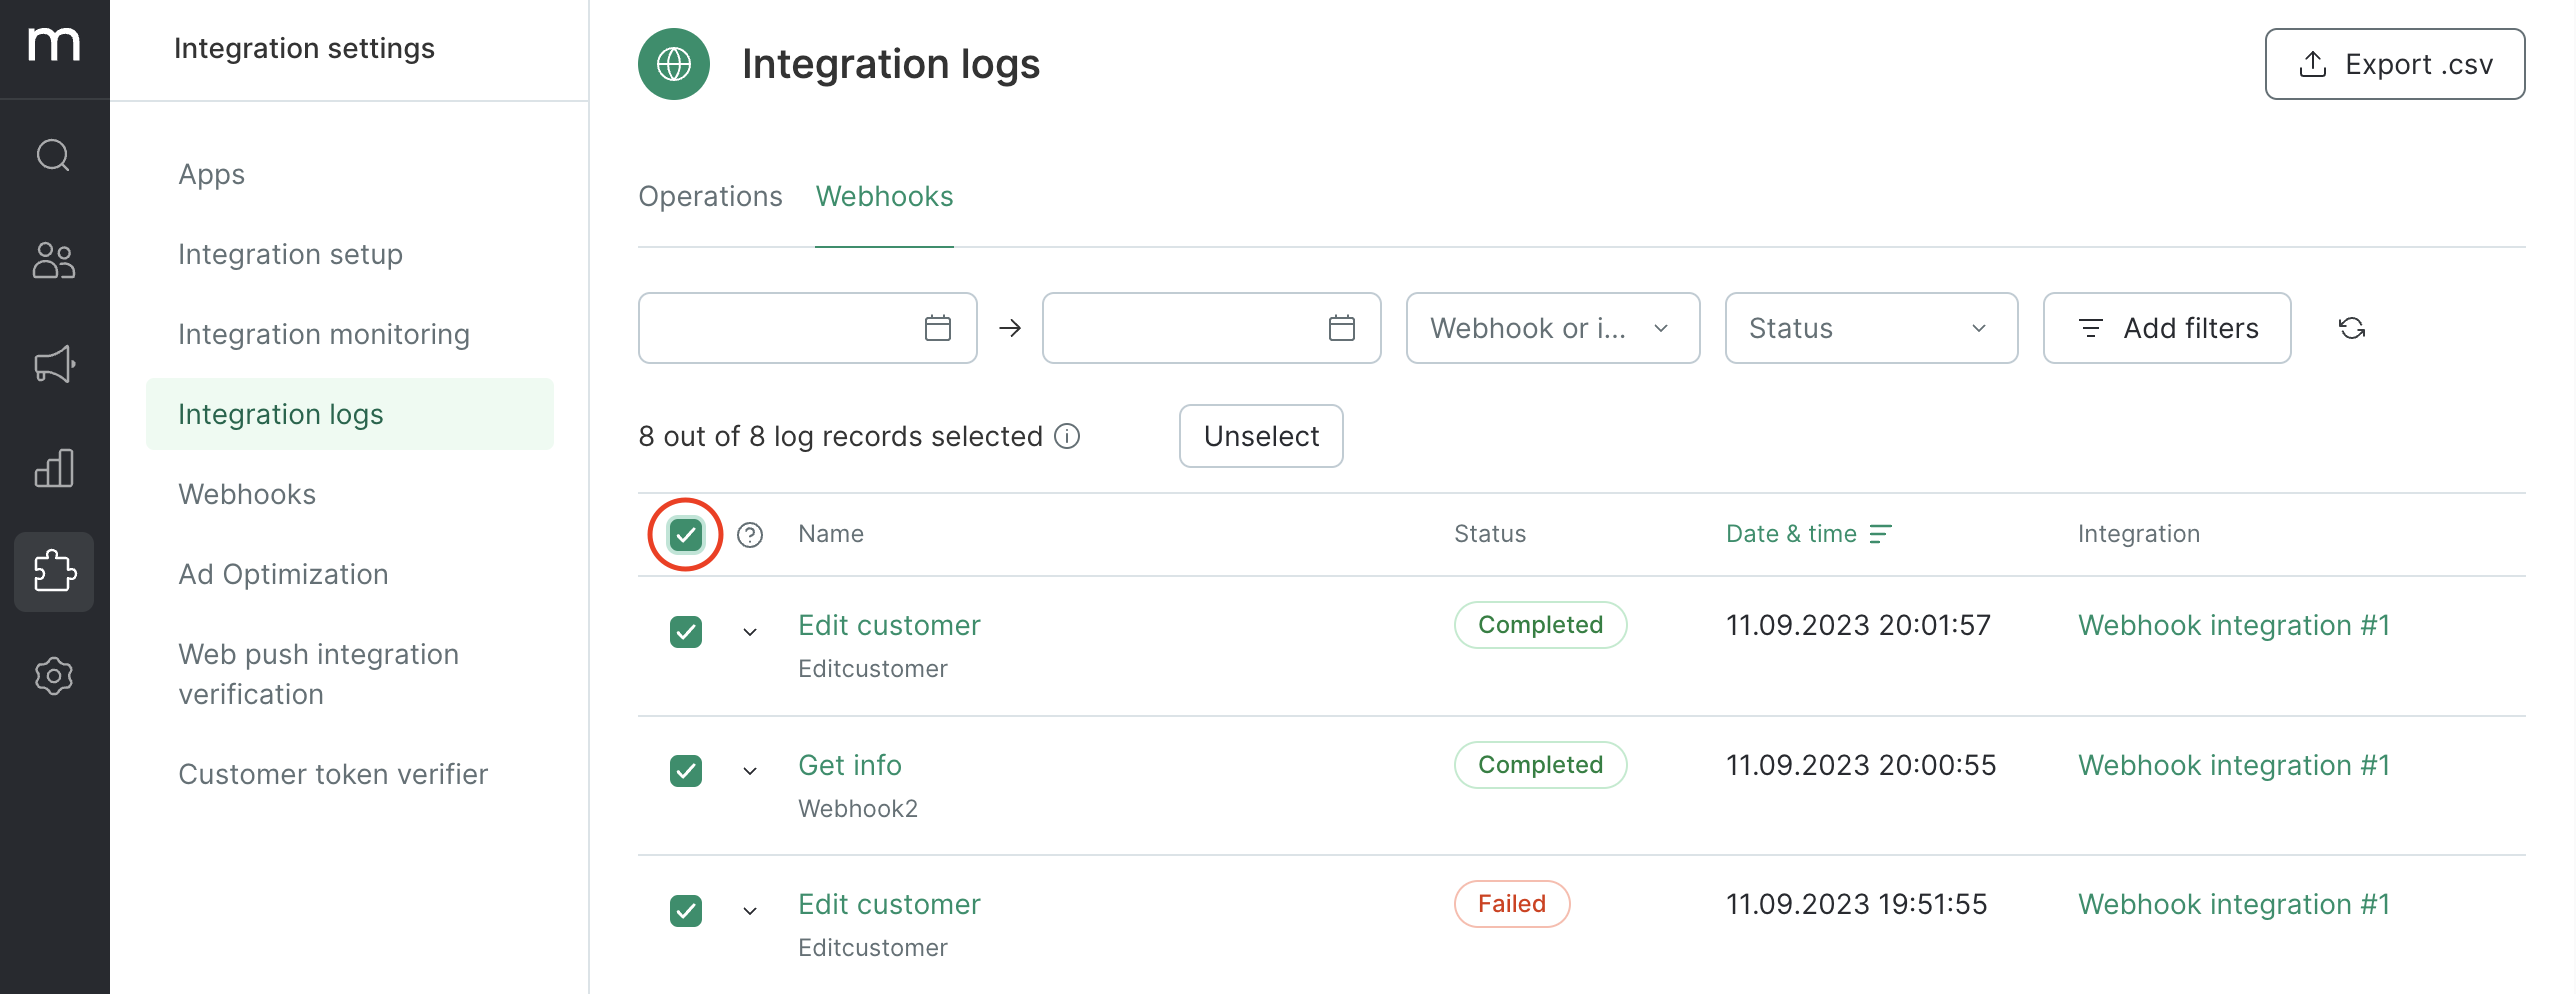
A task is created:
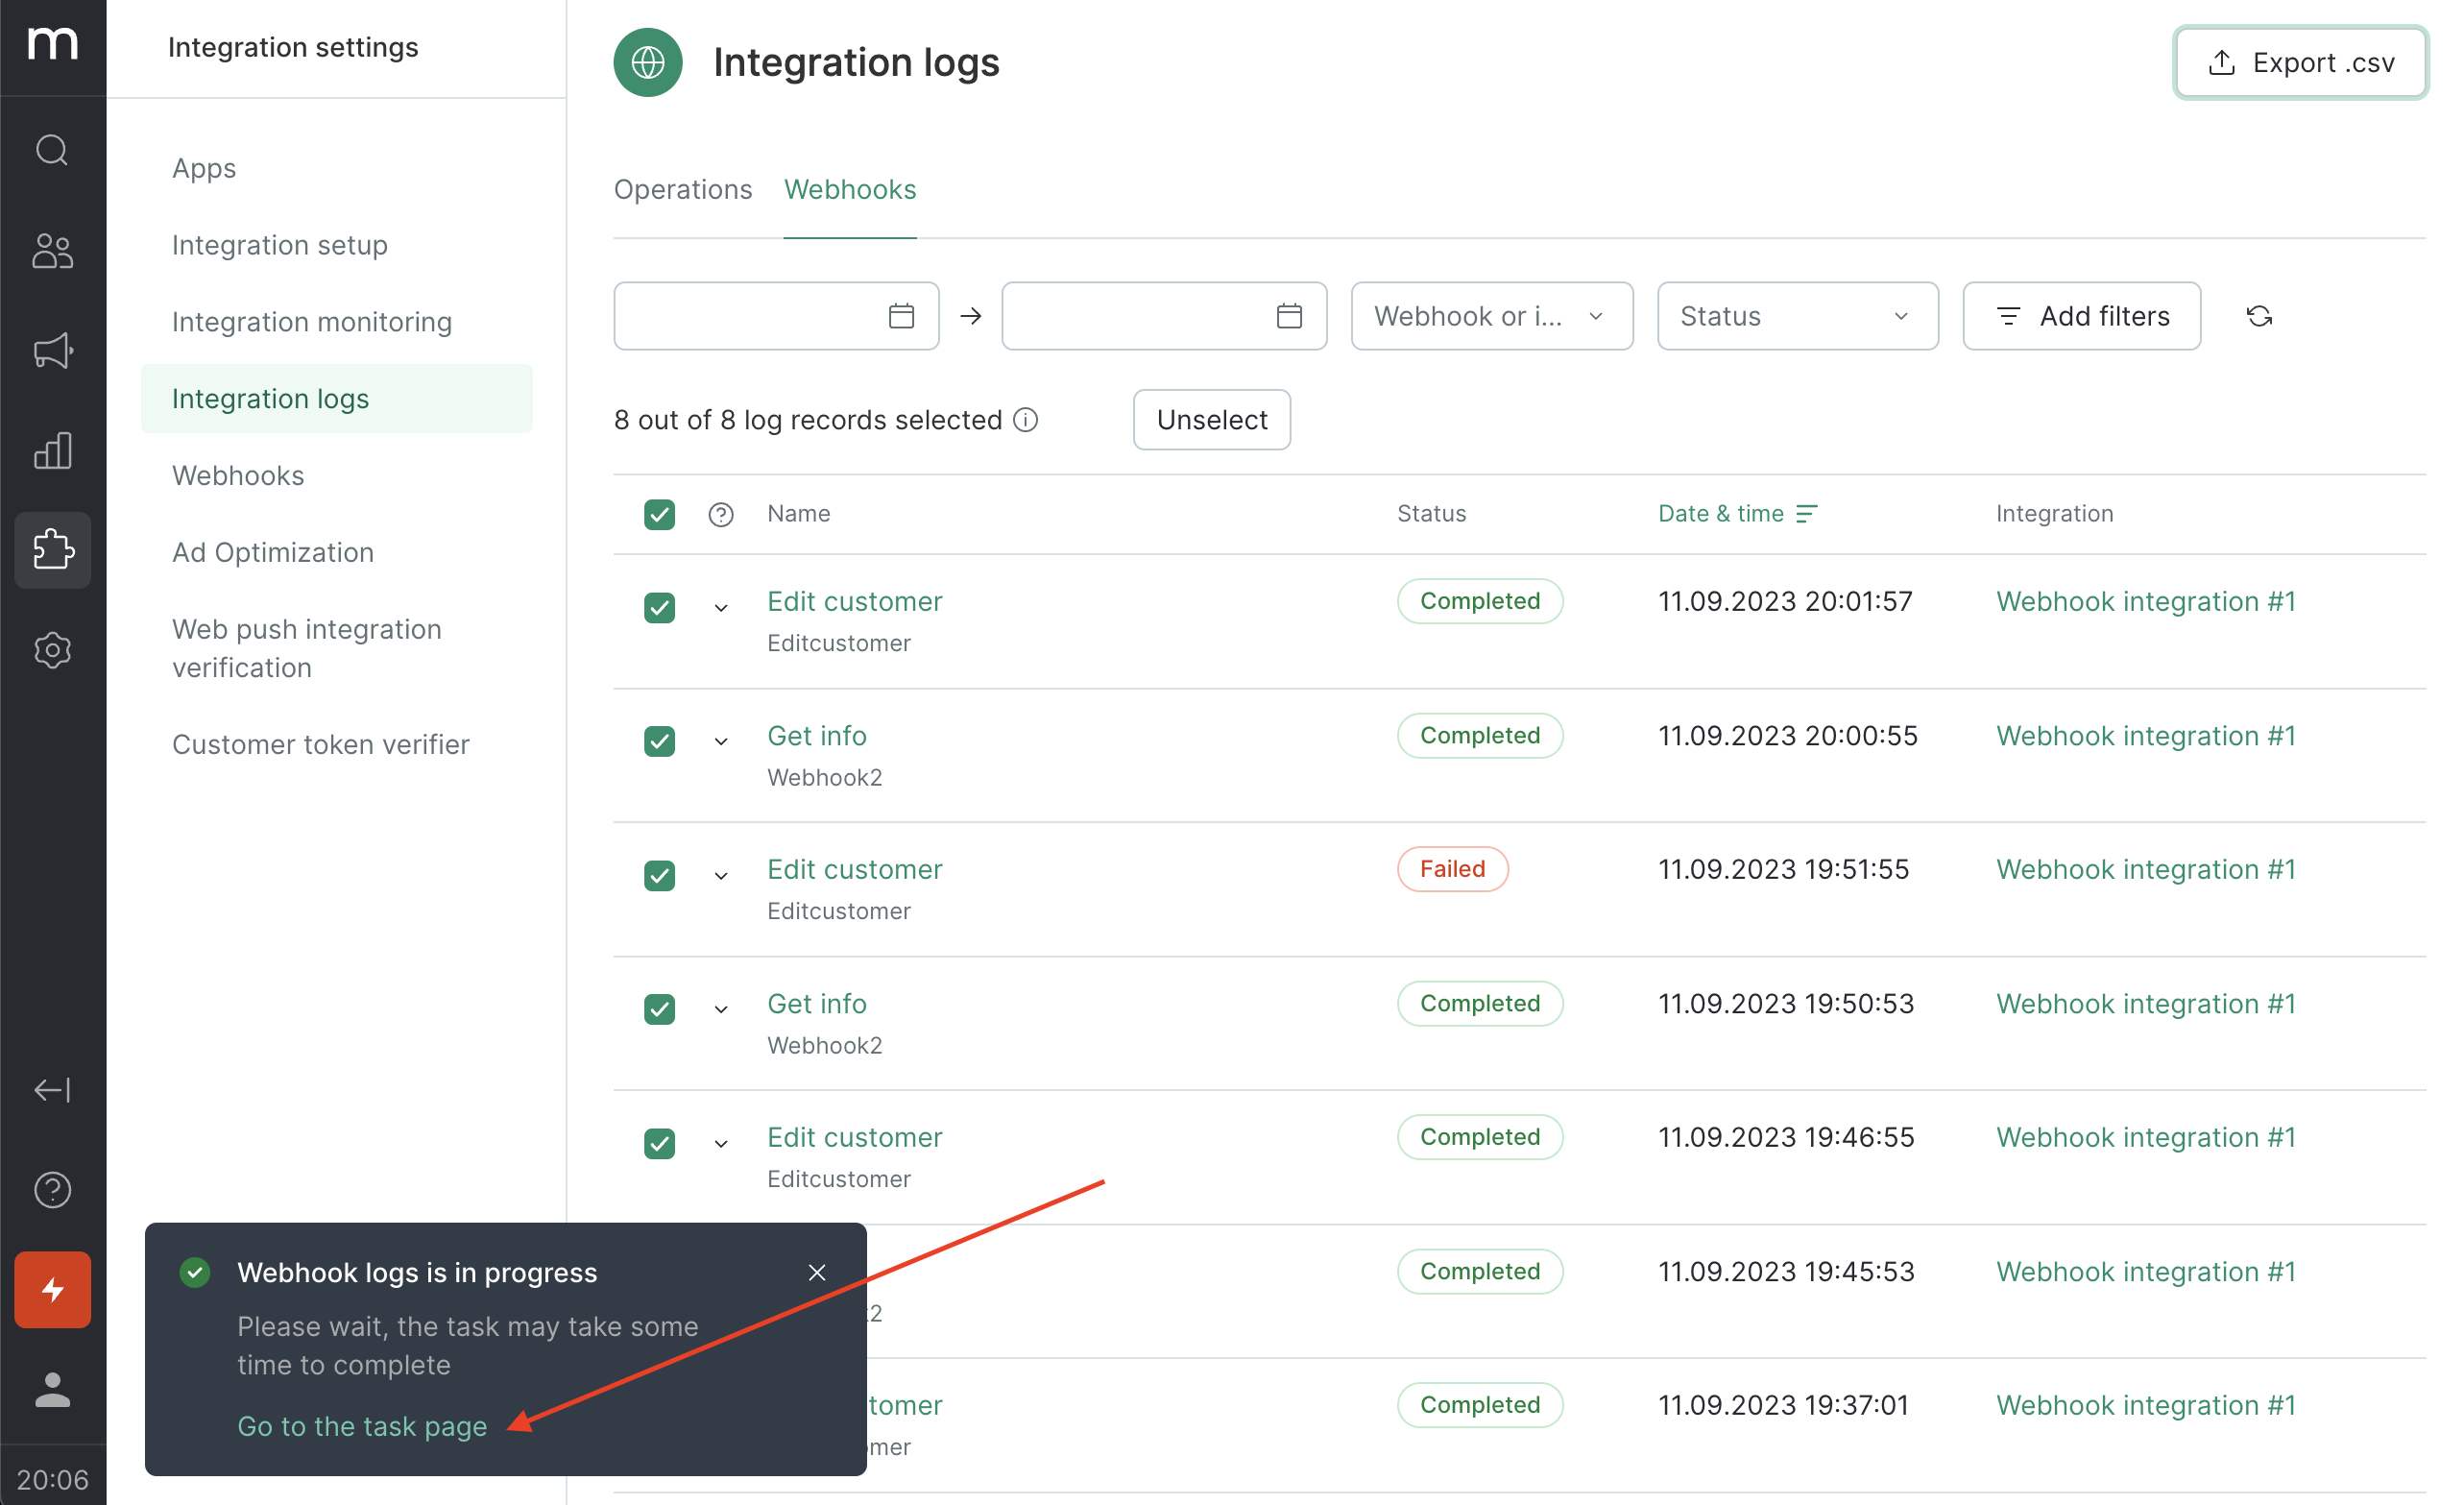
Once the task is finished, you will receive a link to the exported CSV file.
Additionally, you can export logs using the API by following these instructions.