The Email Health report allows you to quickly view and assess the key metrics that affect your email deliverability rate, including:Documentation Index
Fetch the complete documentation index at: https://help.maestra.io/llms.txt
Use this file to discover all available pages before exploring further.
- Open rate (OR).
- Click rate (CR).
- Unsubscribe rate.
- Bounce rate.
- Spam rate.

- The metric percentage based on data collected over the last 30 days.
- The median value for all Maestra clients.
- How the metric has changed over the last 7 days.
- A “How to improve” button for each metric, which can suggest actionable steps to improve scores if they drop.
Your email health score
Your email health score is calculated based on the KPIs as follows:- “Excellent” if all the rates are excellent, and “Good” if they are good.
- “Poor” if at least one rate is rated as poor.
| OR | CR | Hard bounce rate | Unsubscribe rate | Spam rate | |
|---|---|---|---|---|---|
| Excellent | 15% and more | 2.5% and more | 1% and less | 0.5% and less | 0.05% and less |
| Good | 10% and more | 0.8% and more | 2% and less | 1% and less | 0.2% and less |
| Poor | 10% and less | 0.8% and less | 2% and more | 1% and more | 0.2% and more |
Key metrics for email campaigns
Let’s take a closer look at the key metrics.| Metric | Recommendations |
|---|---|
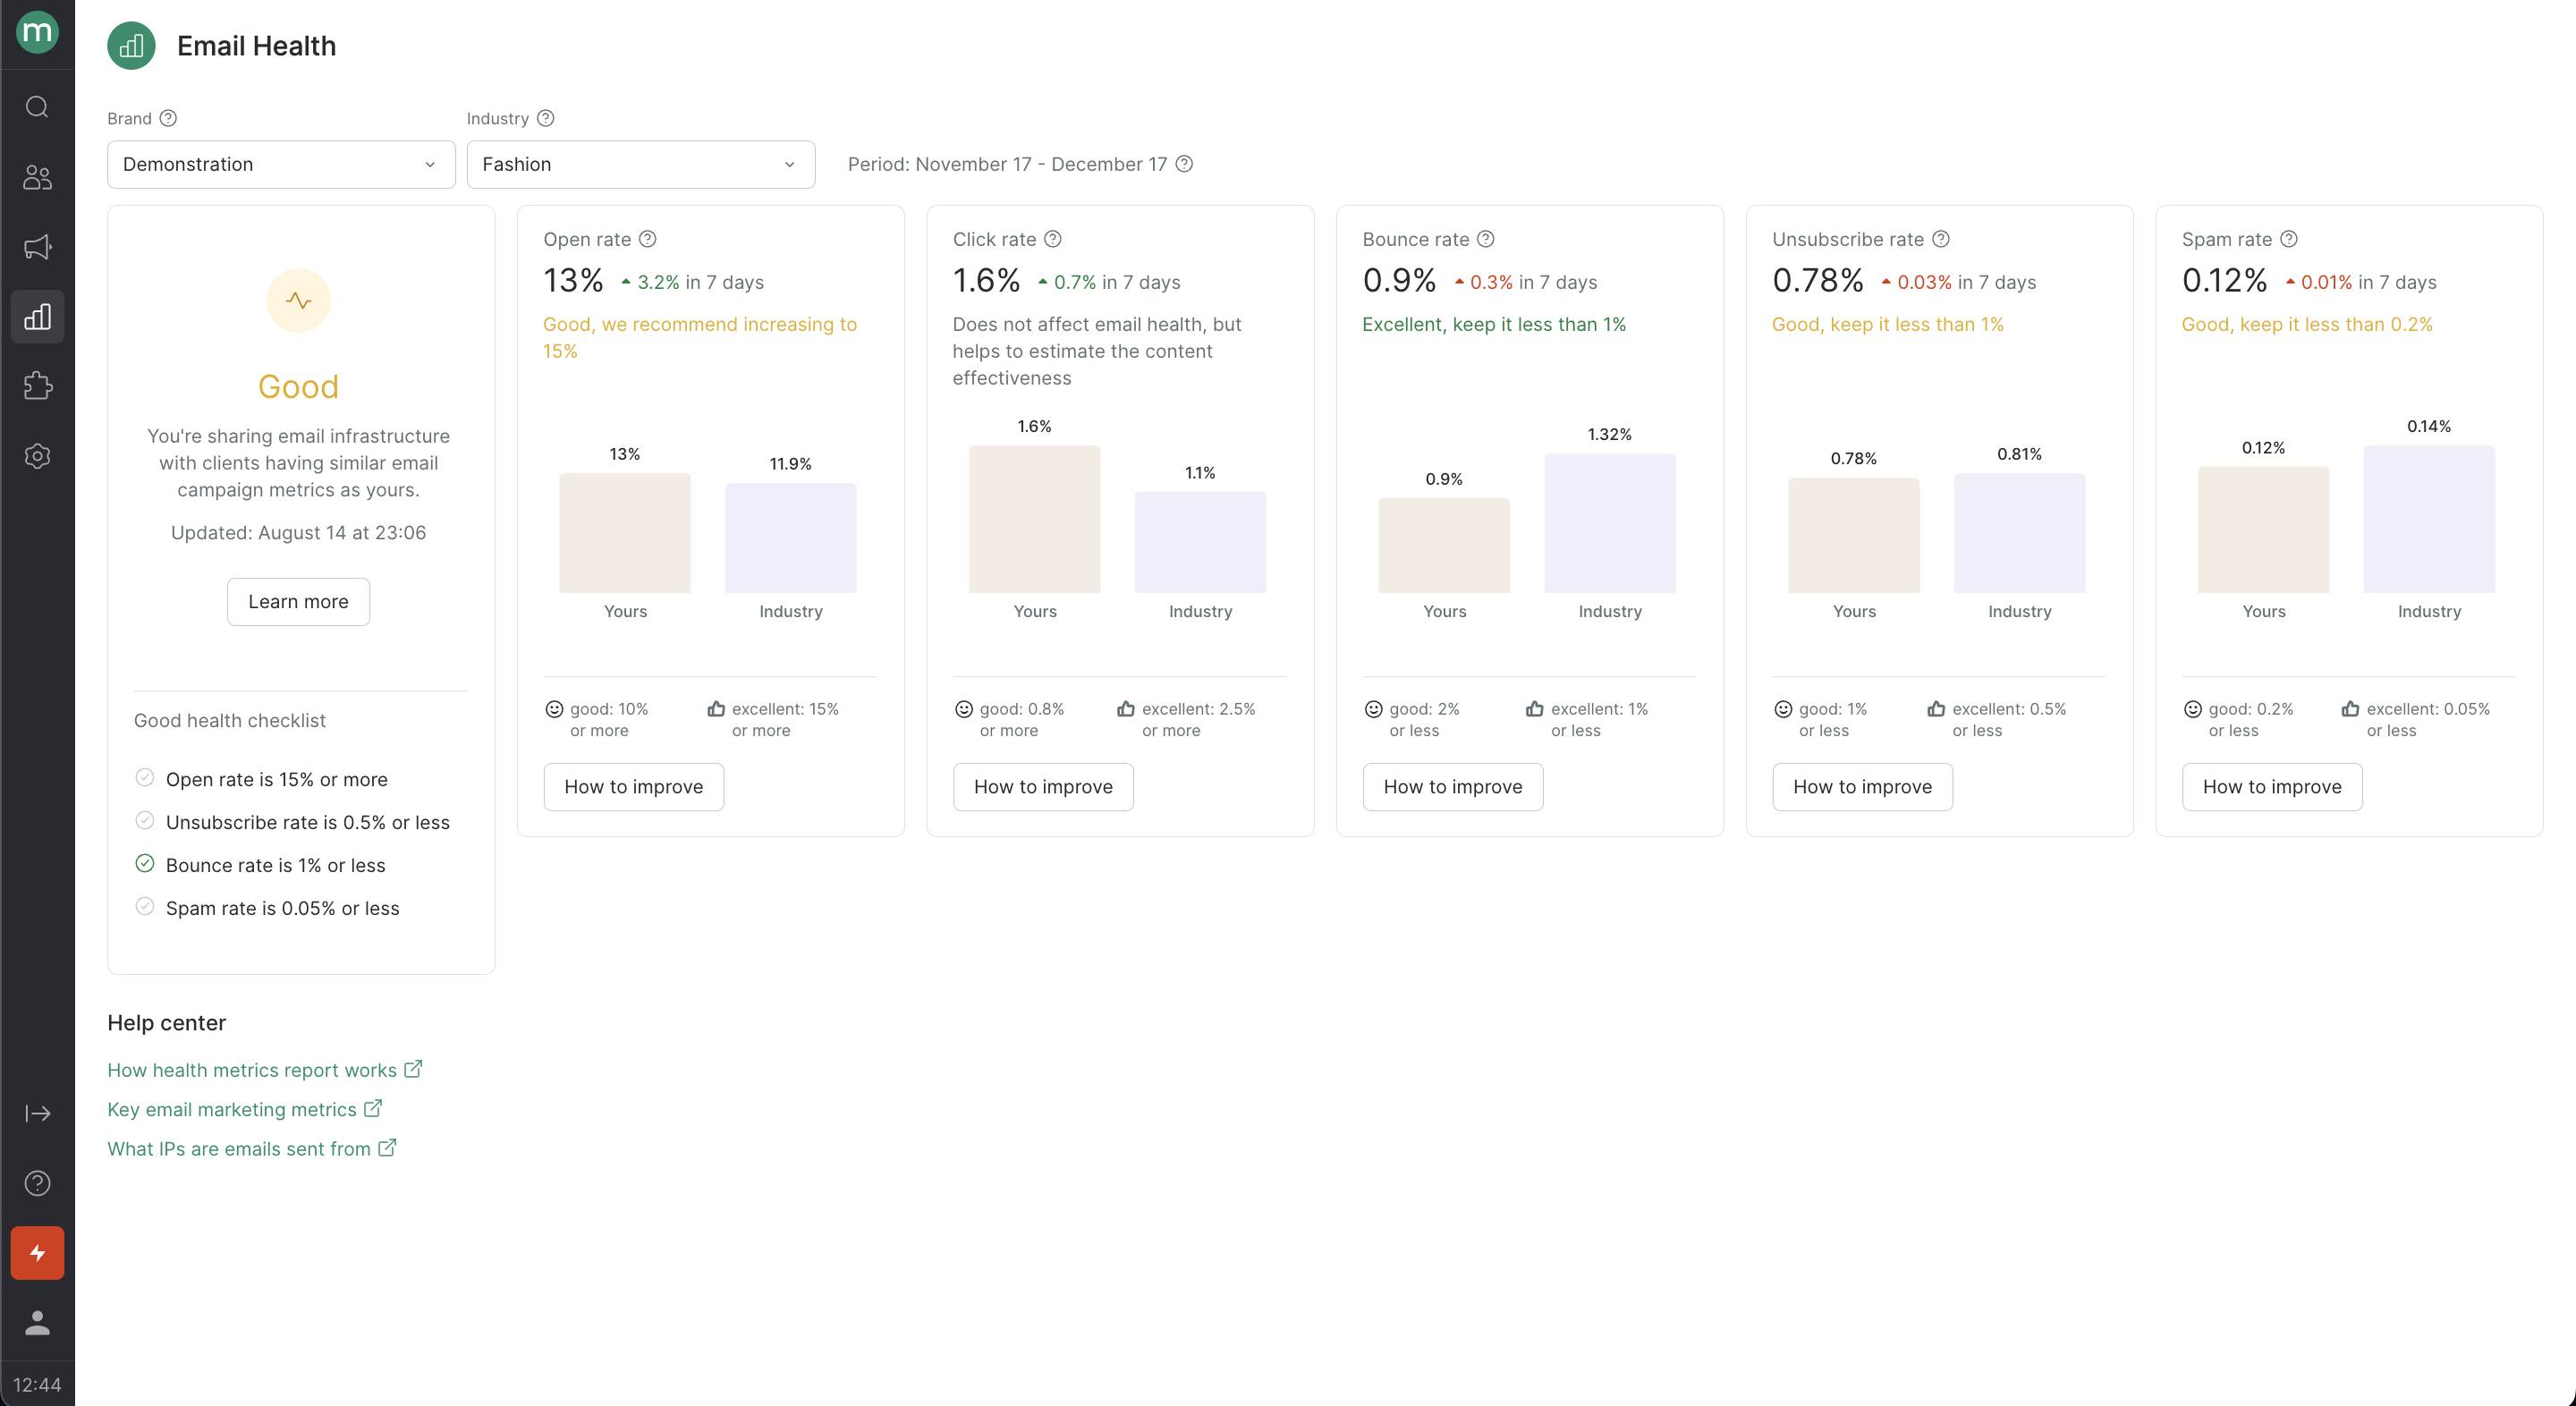
| Open rate This is the ratio of unique opens to messages delivered. A high open rate means that your customers are engaging with your emails, which has a positive impact on deliverability rate. | How to increase your open rate |
| Click rate This is the ratio of unique clicks to messages delivered. A high click rate also means that your customers are engaging with your emails. However, mailing services don’t consider click rate percentage as important as the open rate percentage. | How to increase your click rate |
| Unsubscribe rate This is the ratio of people who unsubscribed to the total number of messages delivered. If your unsubscribe rate percentage is high, this shows mailing services that customers are receiving irrelevant content or that they didn’t give their permission to get your emails. As a result, your deliverability rate suffers. | How to reduce your unsubscribe rate |
| Bounce rate This is the ratio of undelivered messages (due to the addresses being invalid) to the total number of messages sent. This metric helps you assess the quality of your email list. A high hard bounce rate indirectly shows that either your email list is outdated, your subscribers didn’t opt-in to receive your emails, or they didn’t confirm their subscription. | How to reduce your bounce rate |
| Spam rateThis is the ratio of messages reported as spam to the total number of messages delivered. Mailing services view spam reports as a customer action that negatively impacts deliverability. | How to reduce your spam rate |
How to improve your deliverability rate
Each metric in the Email Health report has a “How to improve” button, that leads you to a Recommendations section where you can access the following:- More detailed metrics for bulk and automatic email campaigns that pinpoint areas for improvement.
- Best practices for improving metric performance.
- Links to articles on segmenting your email list and improving deliverability.